Backtest Analysis Report
Summary
| Metric | Value |
|---|---|
| Name | Testing File 3 |
| Backtest File | import.csv |
| Backtest Type | cloudquant |
| Optimizing | Profit |
| Aggression Factor | 33 |
| Direction | short |
| Number of Trades | 12,163 |
| First Trade Date | 2020-01-01 |
| Last Trade Date | 2023-12-28 |
| Range in Days | 1,457 |
| Number of Columns | 9 |
Column Analysis
| Indicator | Comparison | Value | Rank | Total Profit Improvement | Curve Quality Improvement | Better Trades | Worse Trades |
|---|---|---|---|---|---|---|---|
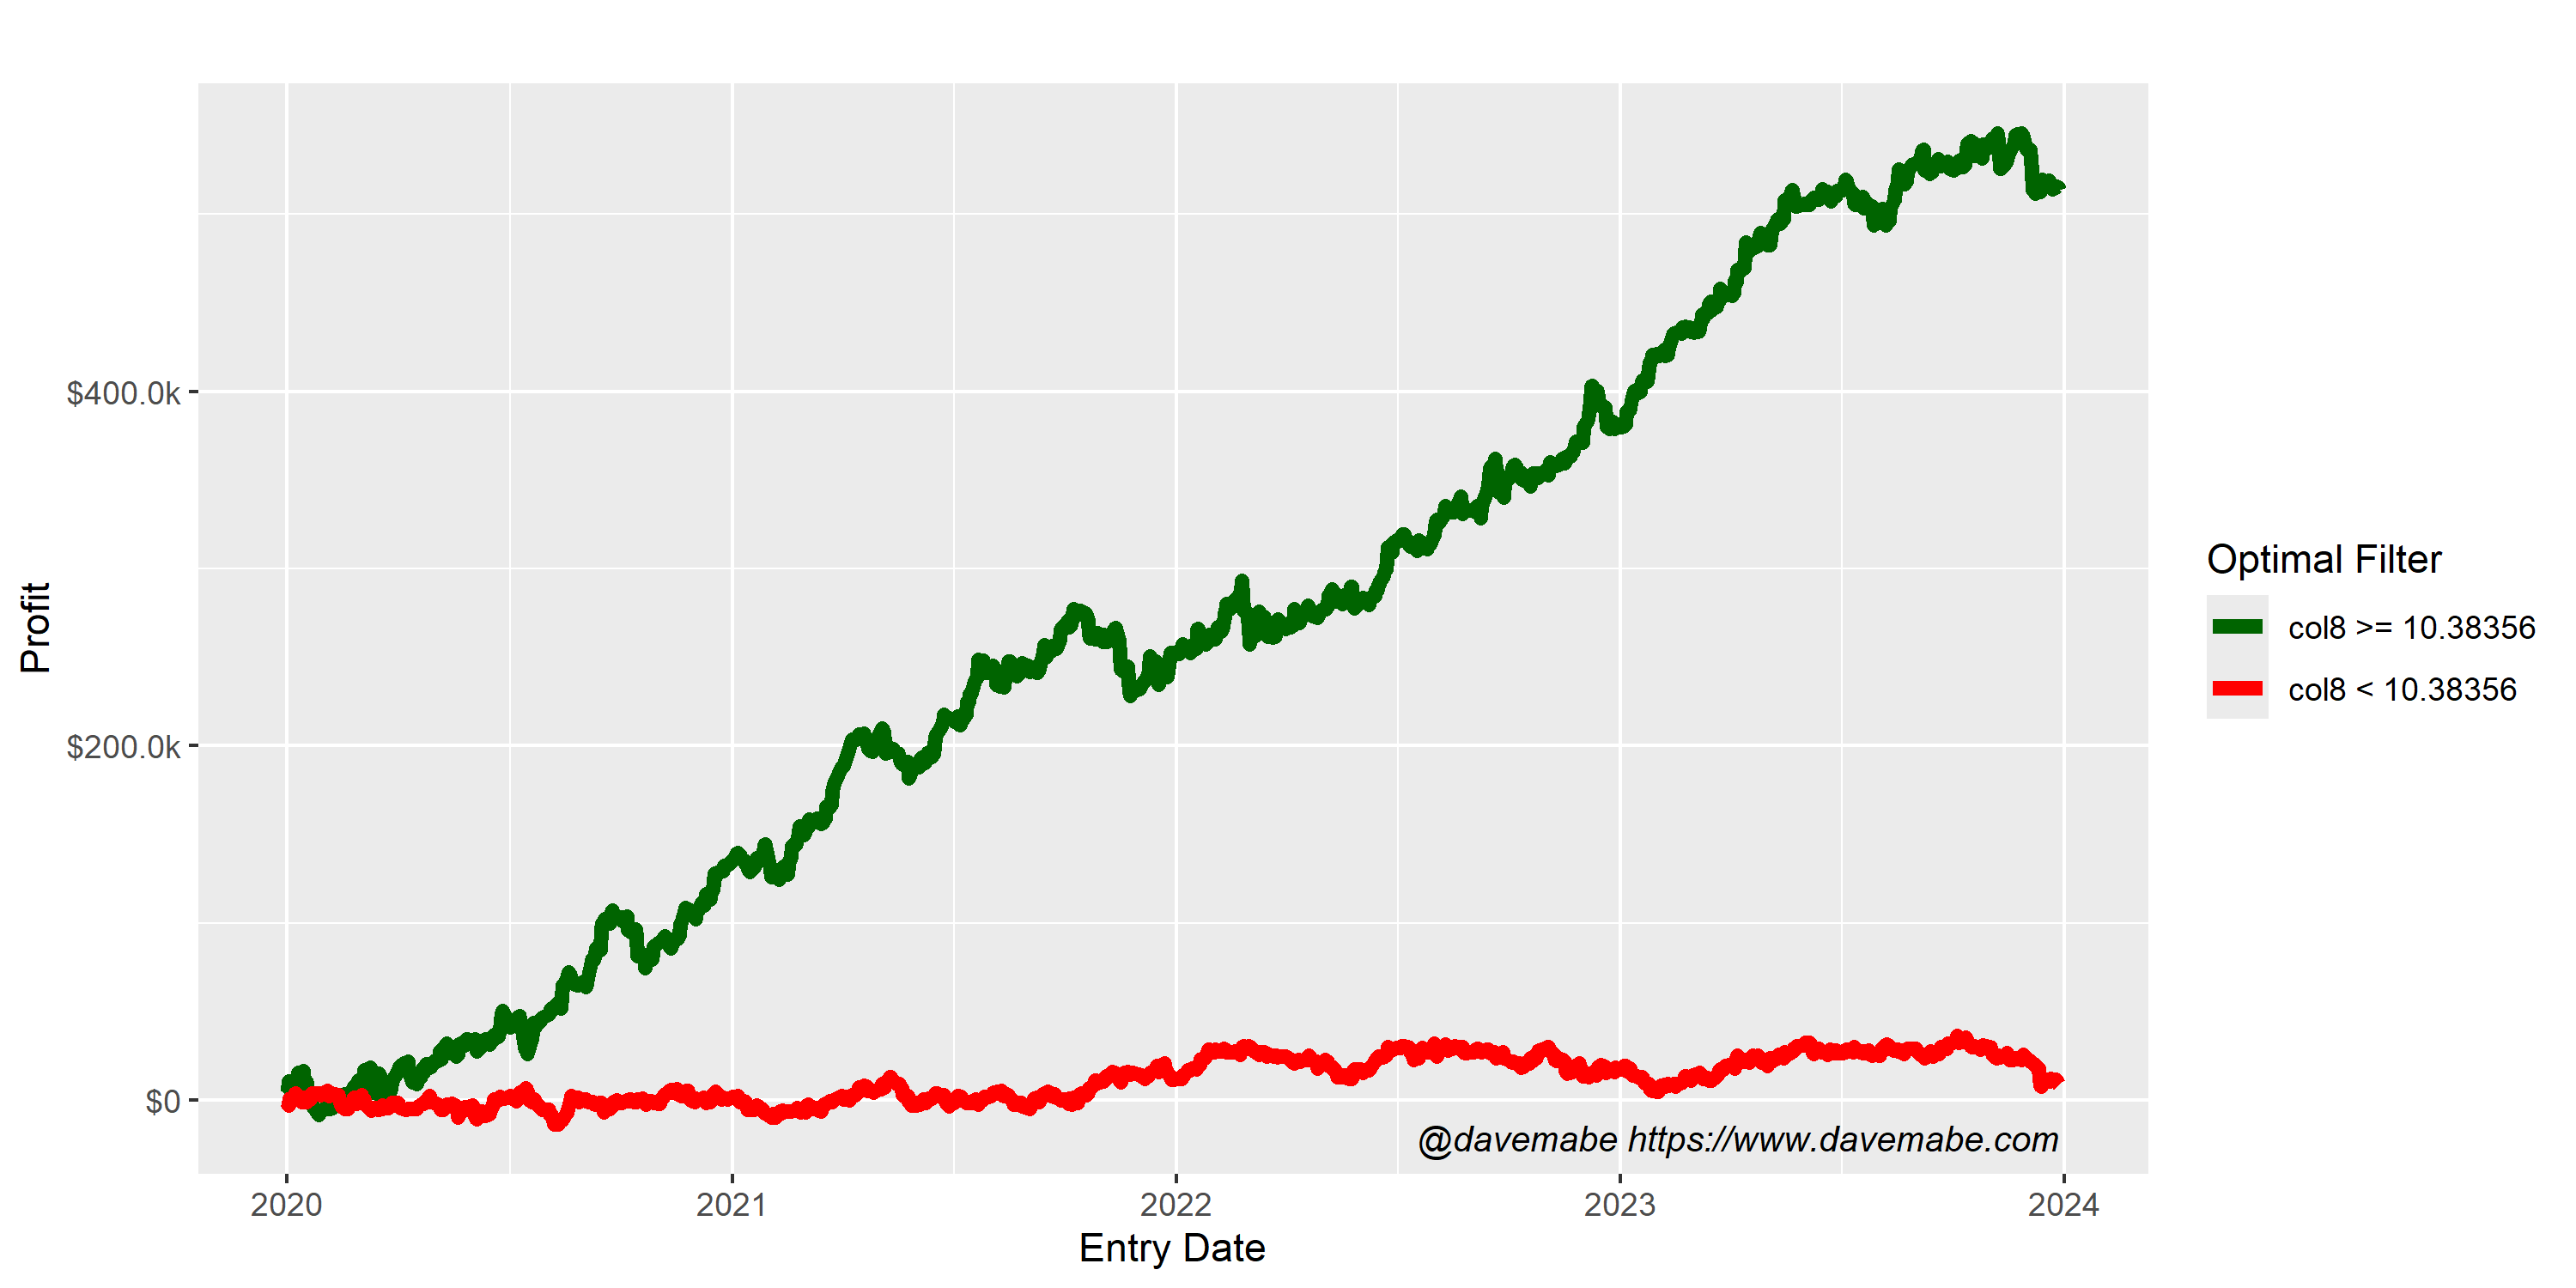
| entry_collect.col8 | >= | 10.3836 | 1 | 504,819 | 0.51 | 5,013 | 7,150 |
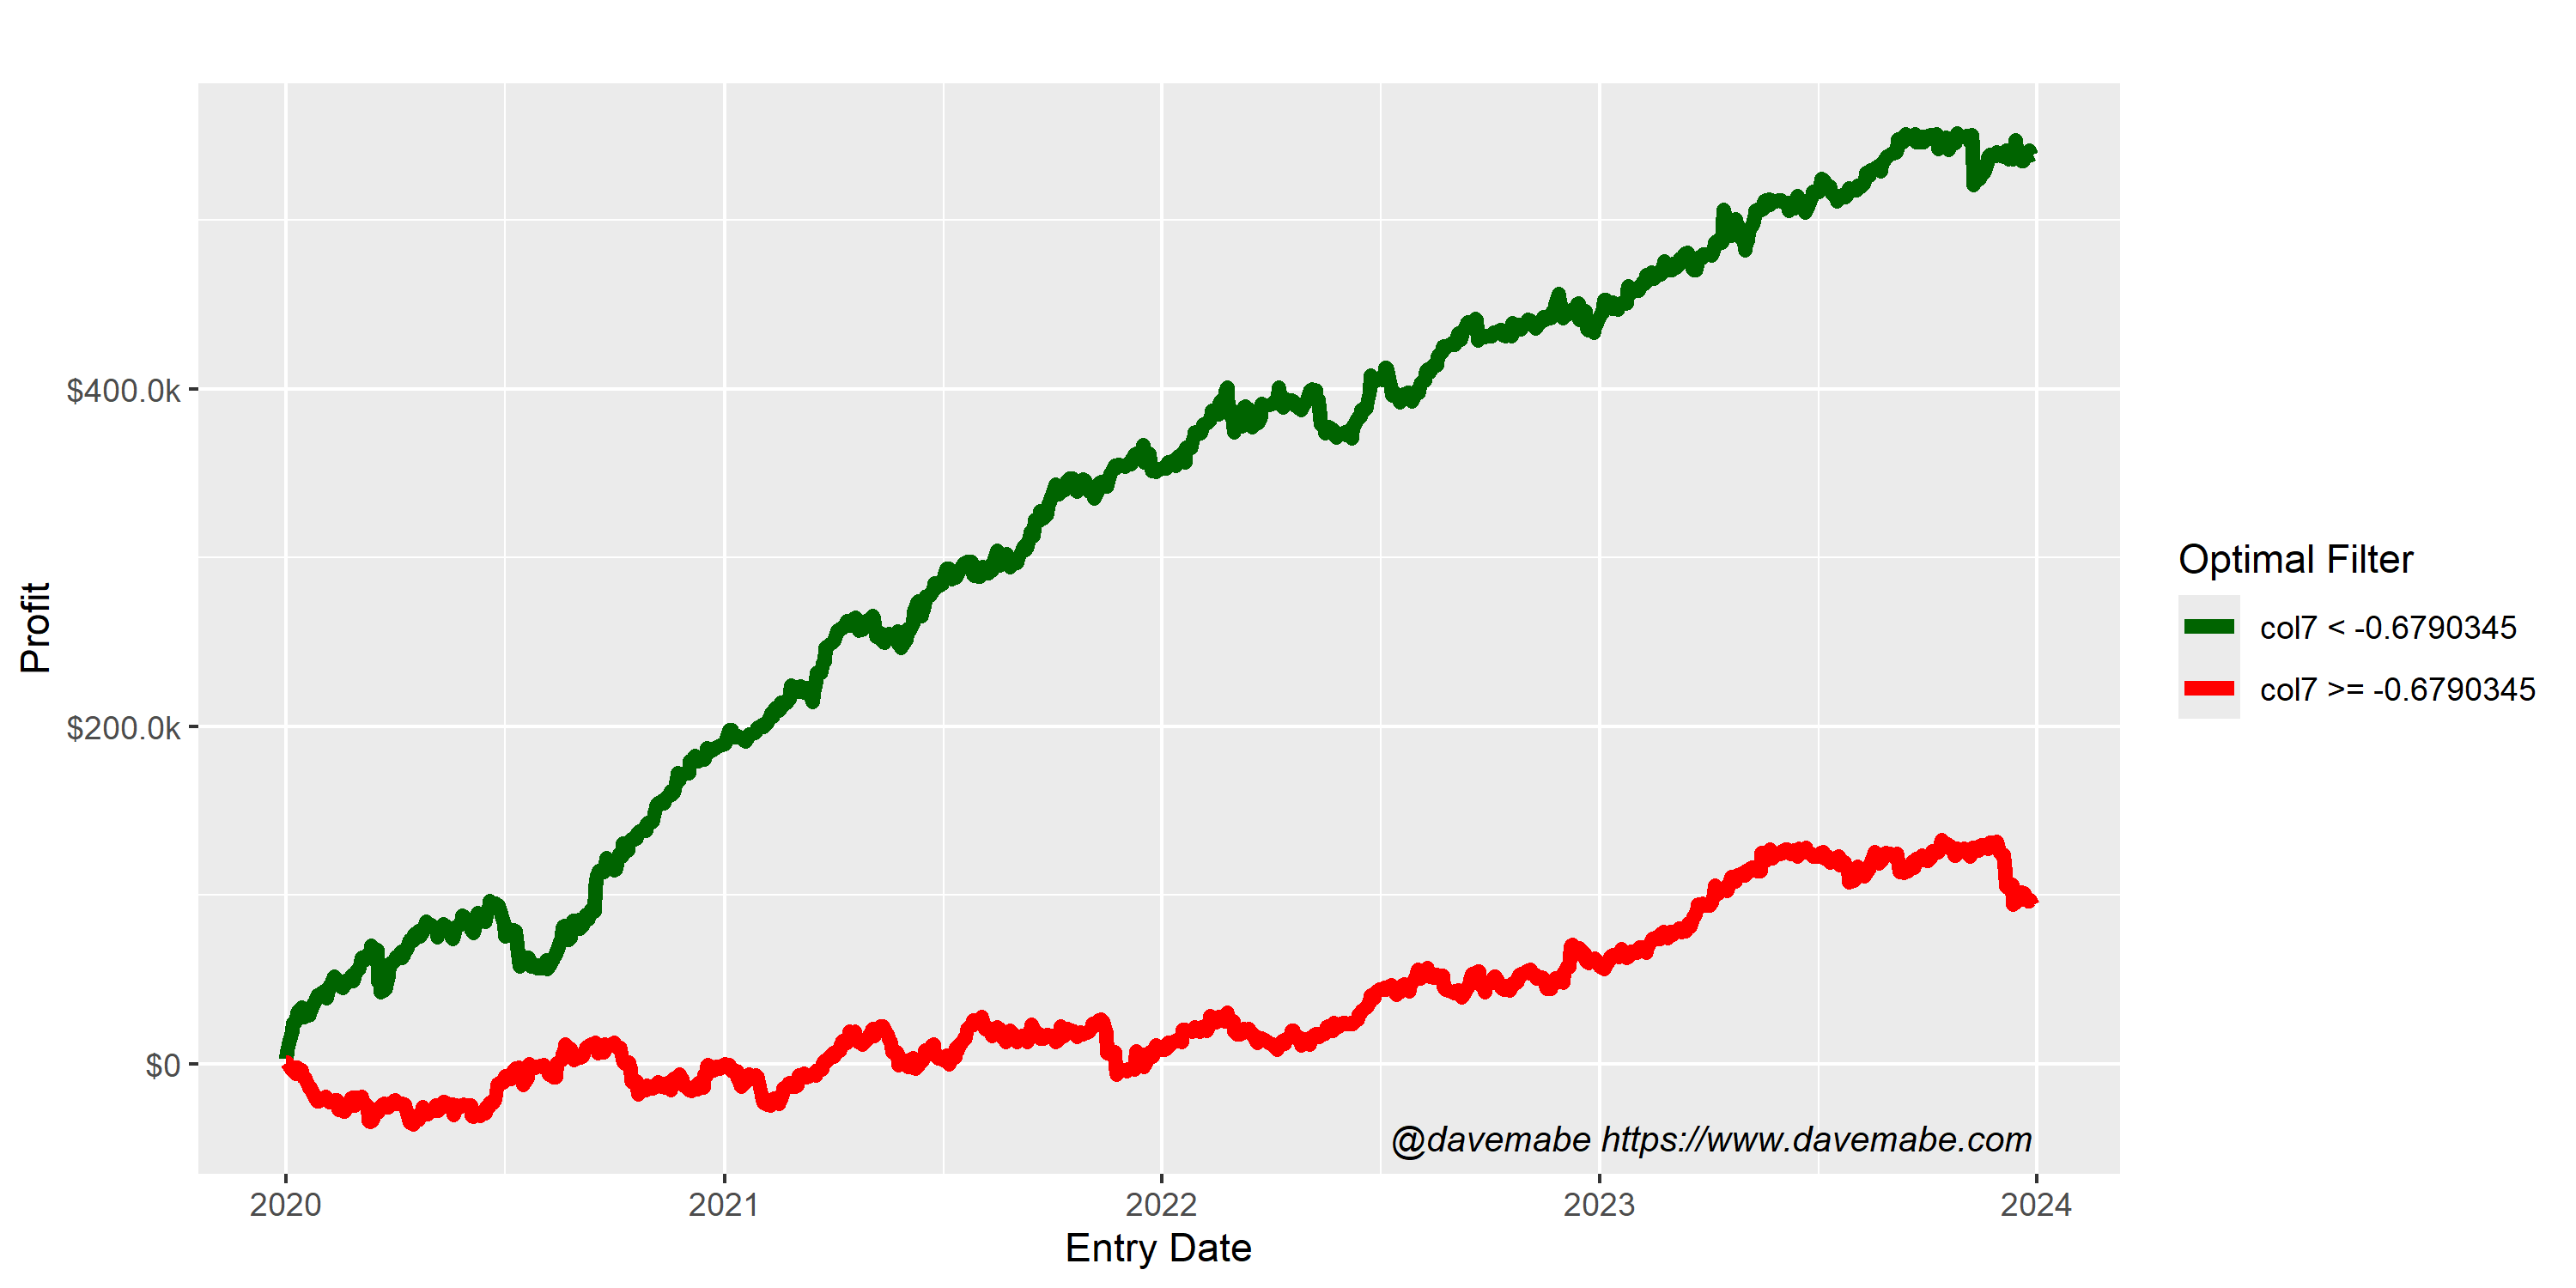
| entry_collect.col7 | < | -0.6790 | 2 | 445,688 | 0.06 | 4,107 | 8,056 |
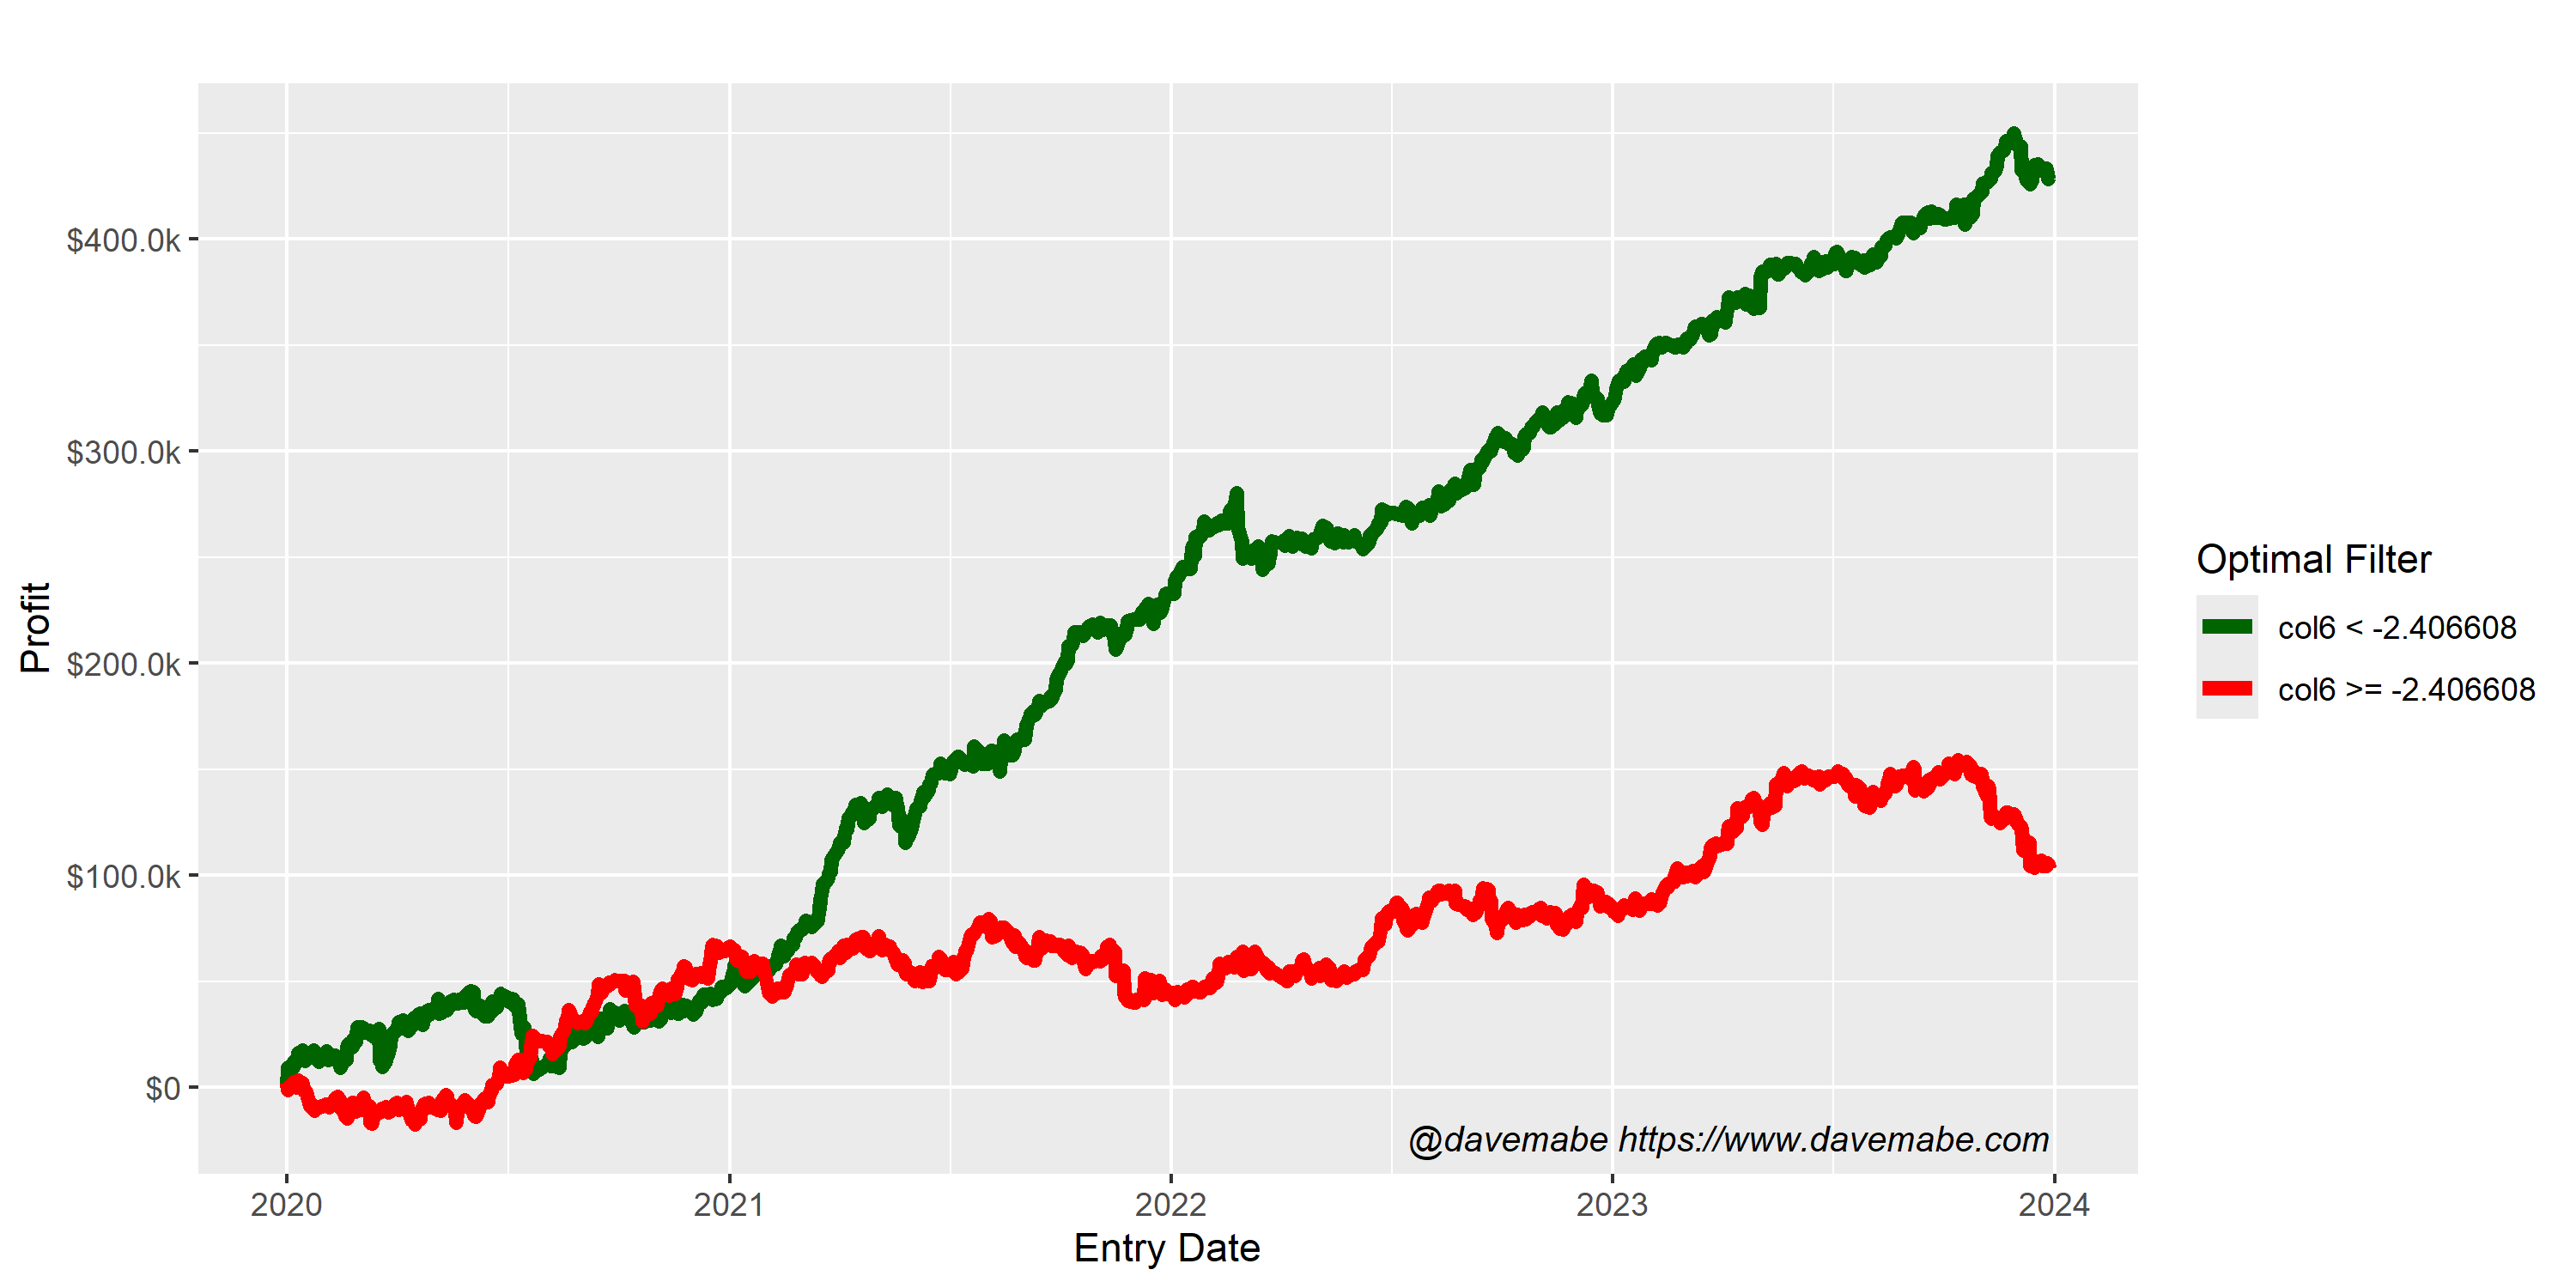
| entry_collect.col6 | < | -2.4066 | 3 | 326,904 | 0.10 | 4,650 | 7,513 |
| entry_collect.col3 | >= | 4.0547 | 4 | 315,254 | 0.03 | 4,615 | 7,548 |
| entry_collect.col5 | < | 2.0351 | 5 | 297,811 | 0.18 | 4,261 | 7,902 |
| entry_collect.col4 | < | 2.8050 | 6 | 223,152 | 0.19 | 5,304 | 6,859 |
| entry_collect.col1 | < | 0.2309 | 7 | 164,905 | 0.12 | 4,918 | 7,245 |
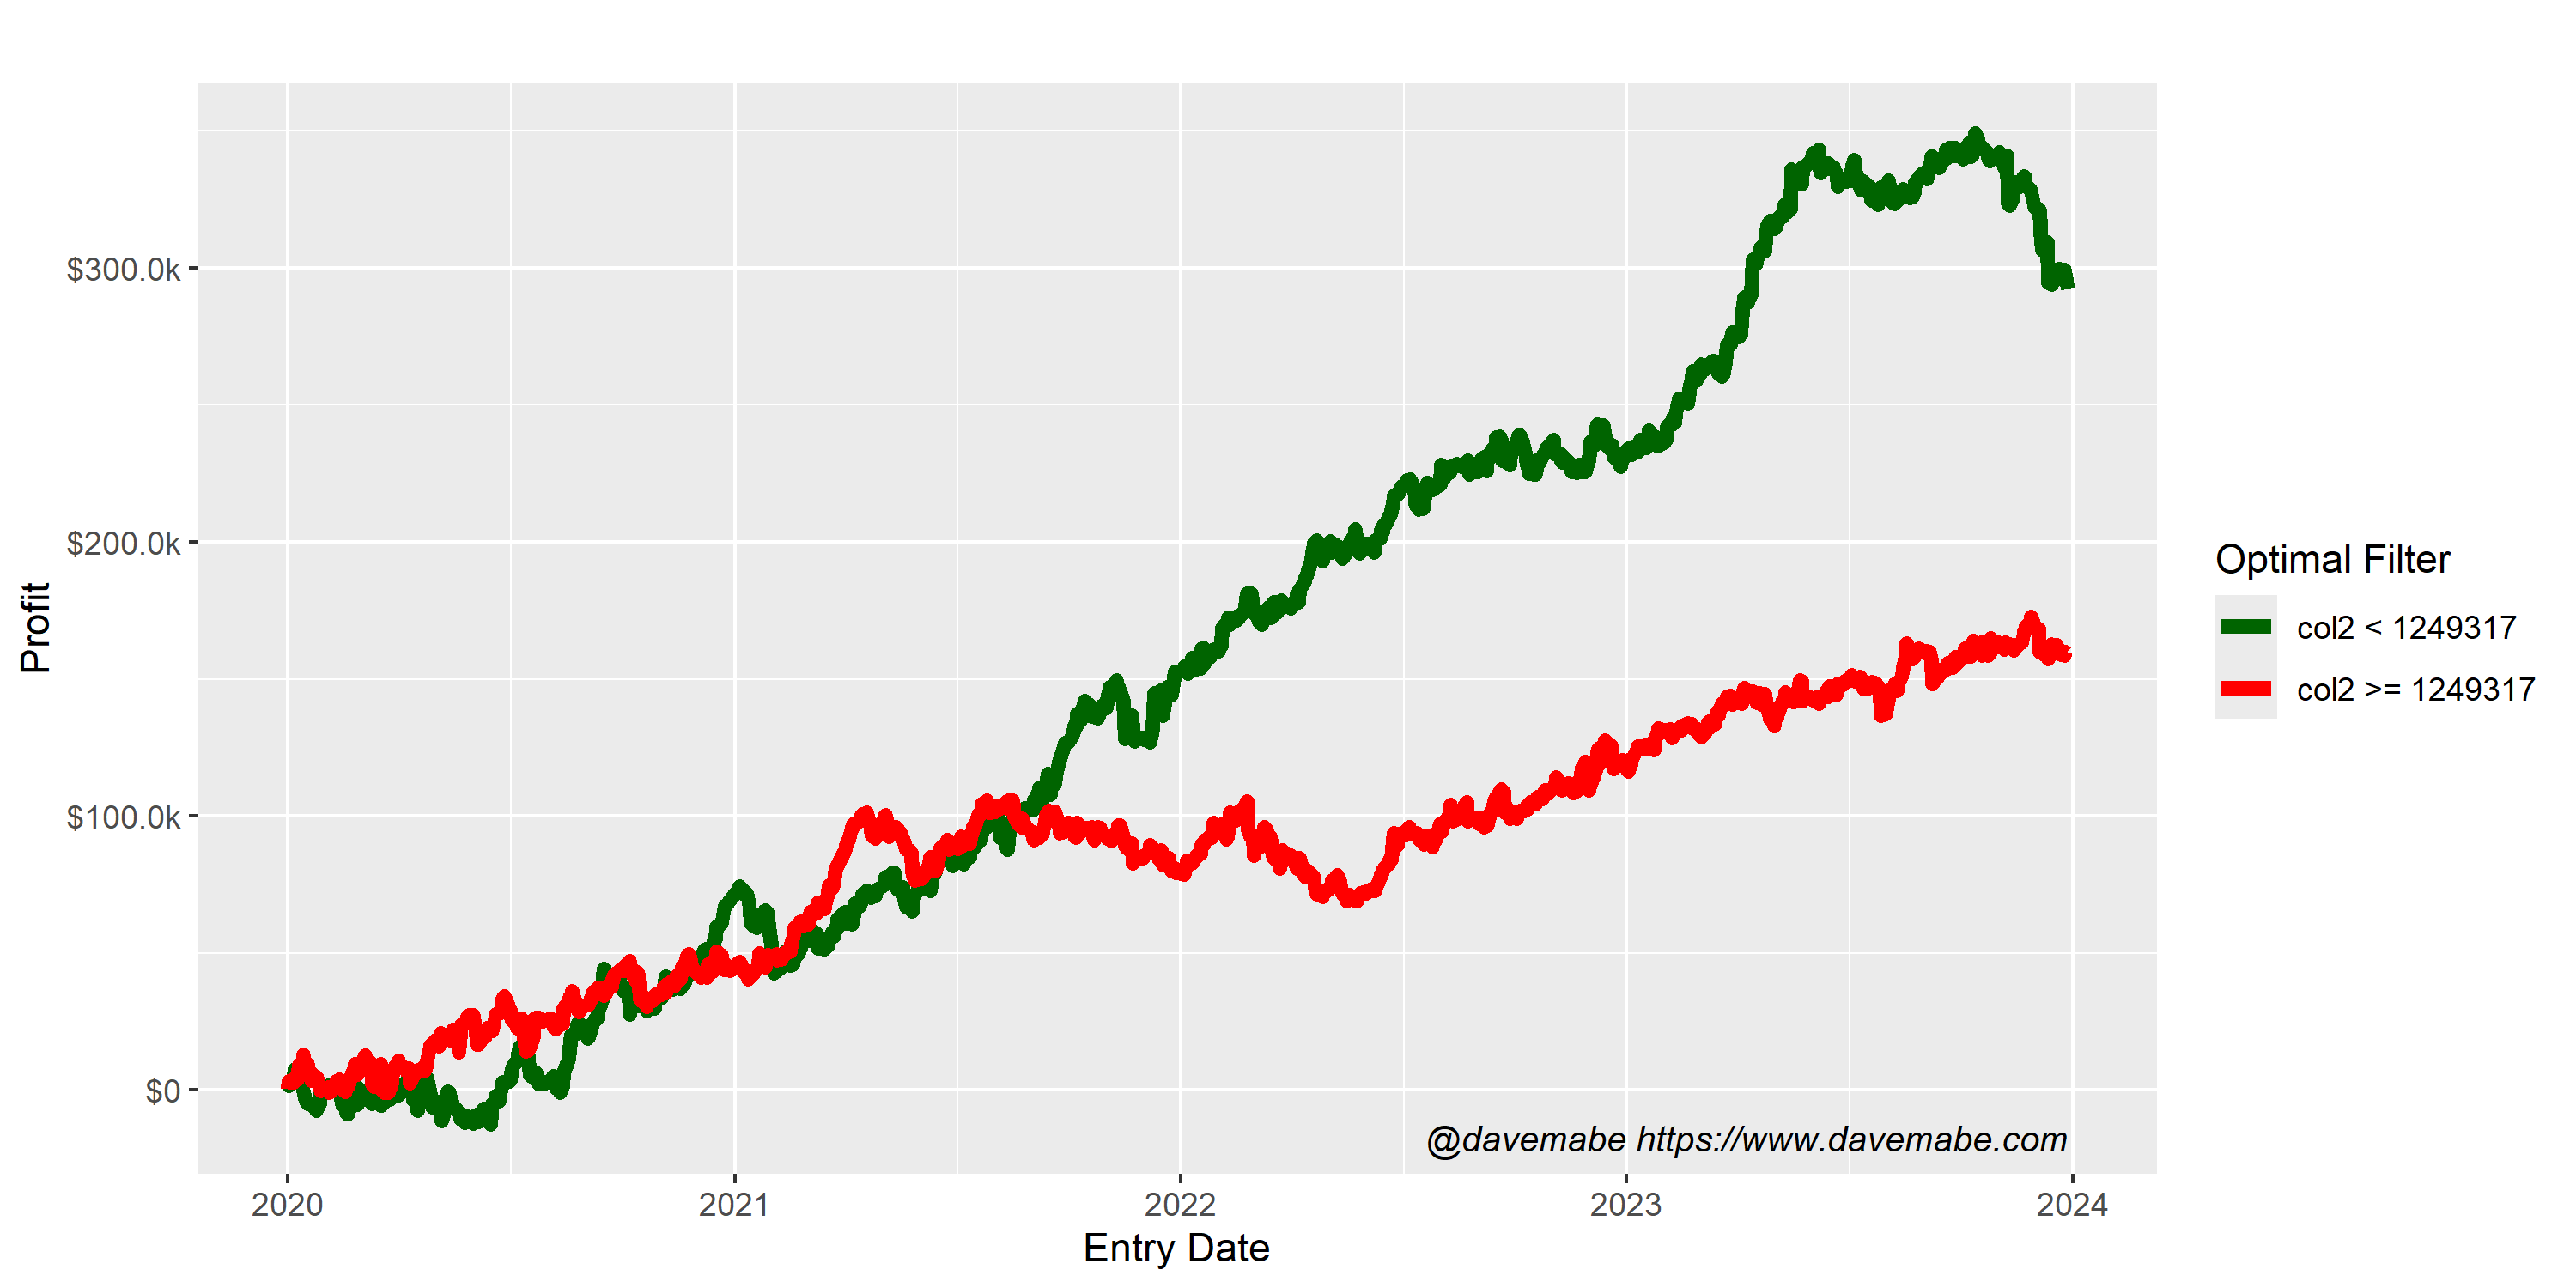
| entry_collect.col2 | < | 1,249,317 | 8 | 132,657 | 0.07 | 5,071 | 7,092 |
Column Charts
Charts for optimal filter values
1.
2.
3.
4.
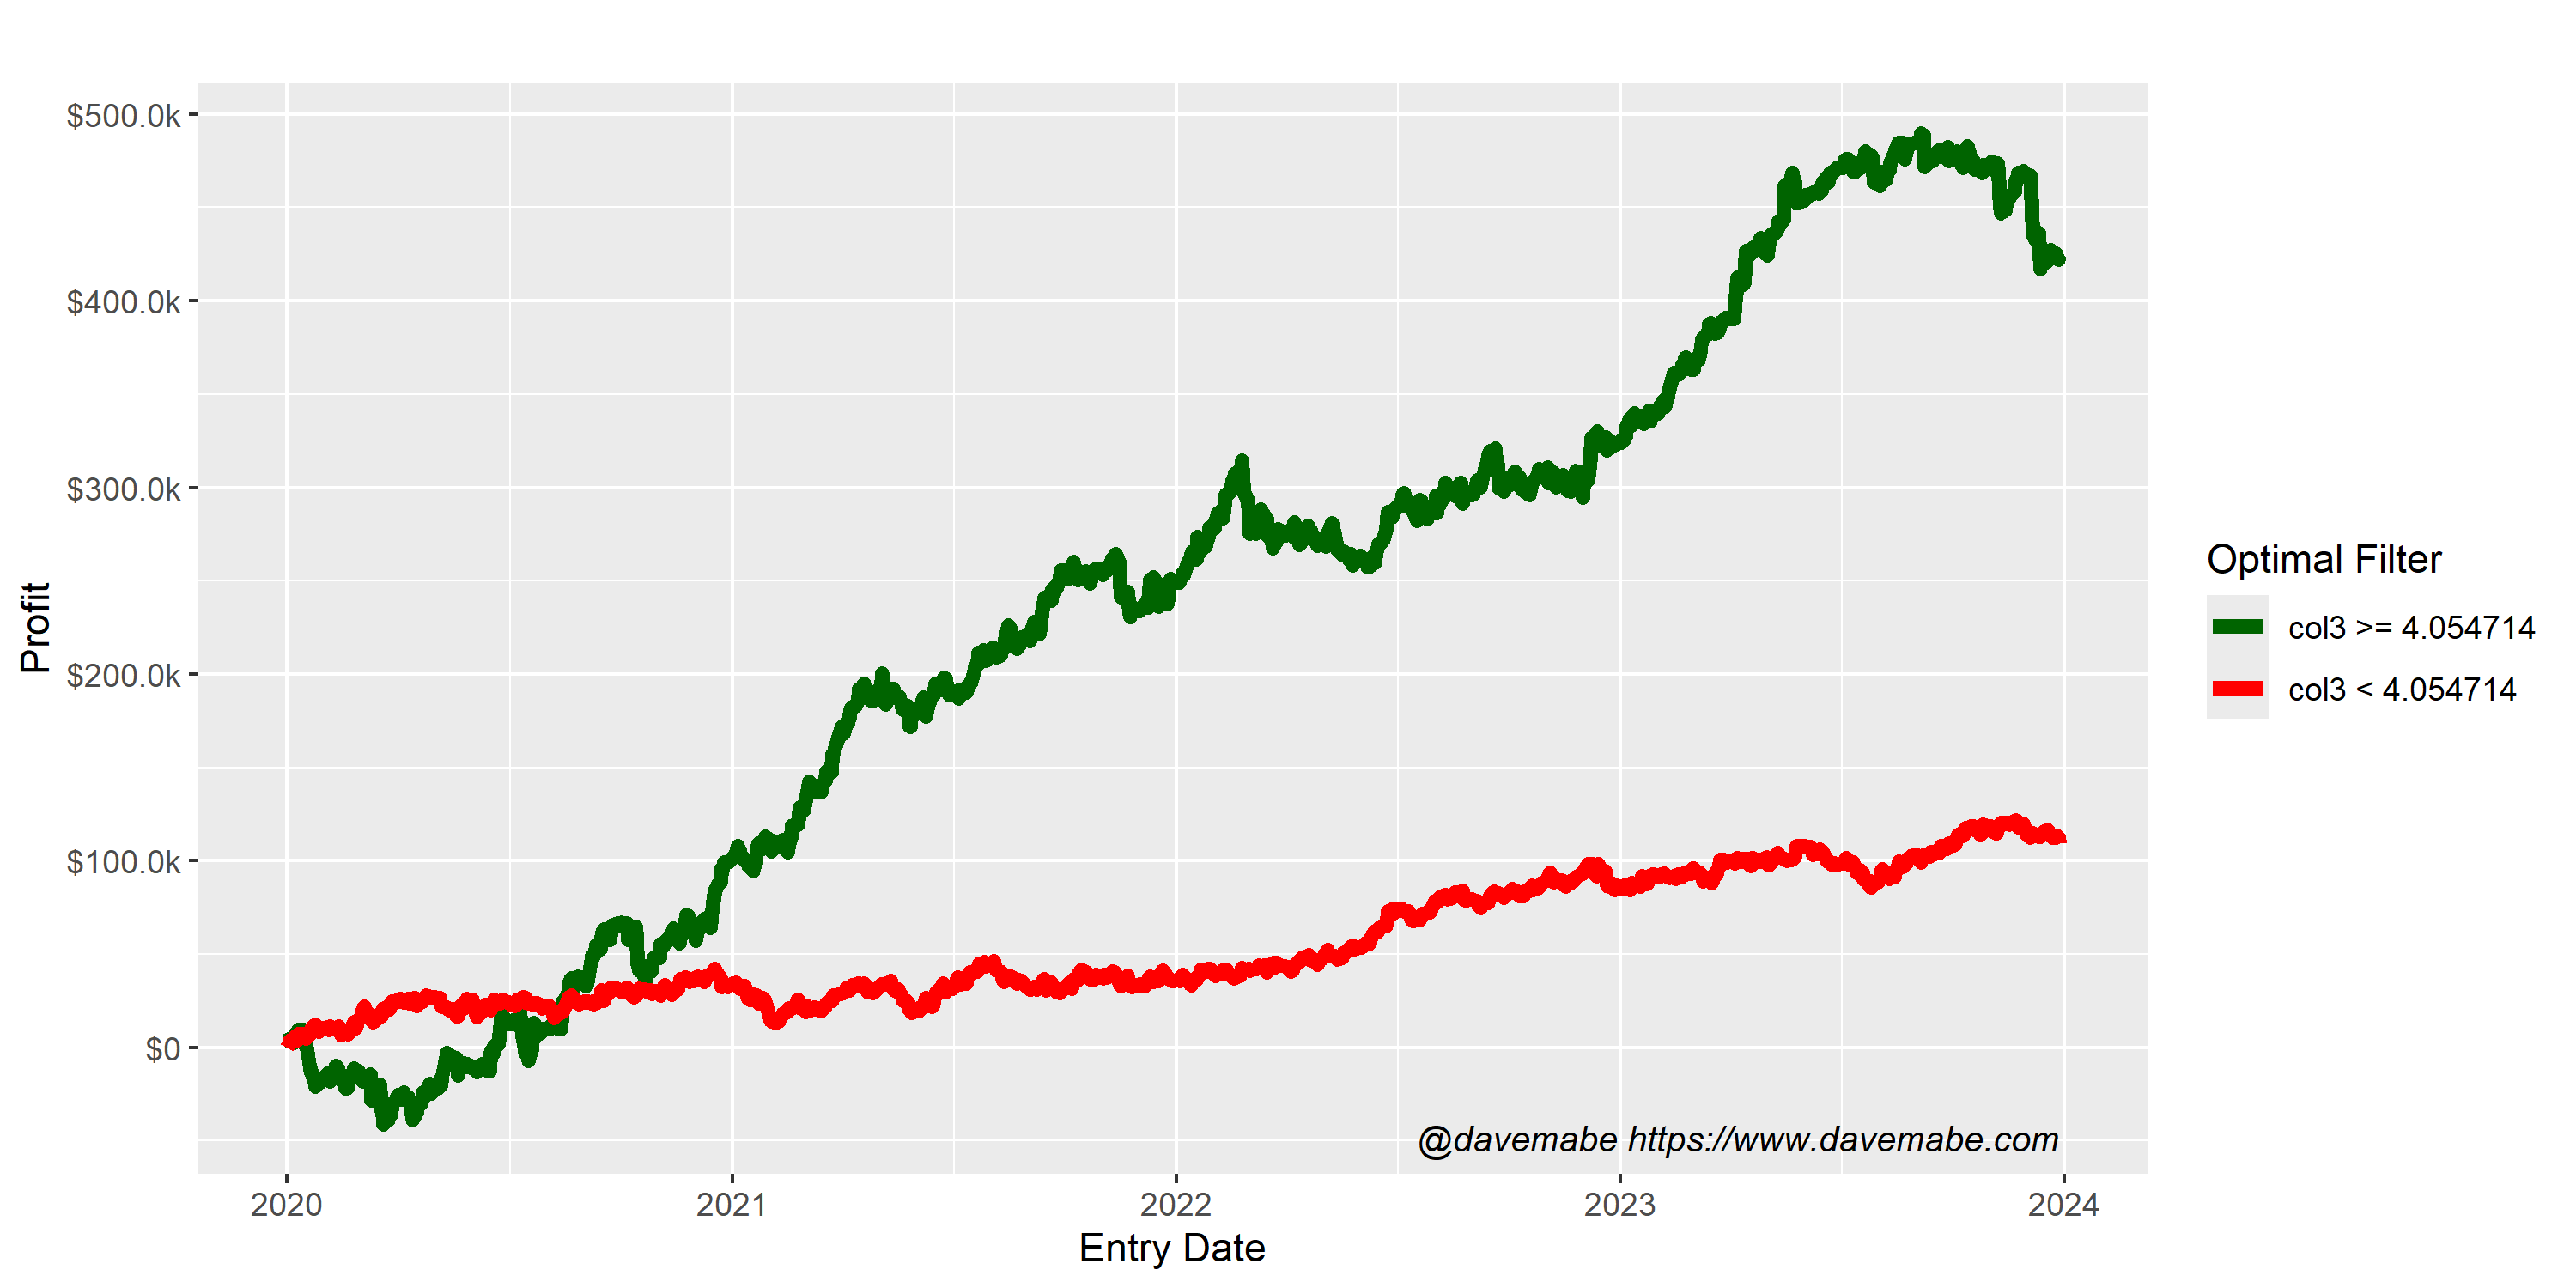
5.
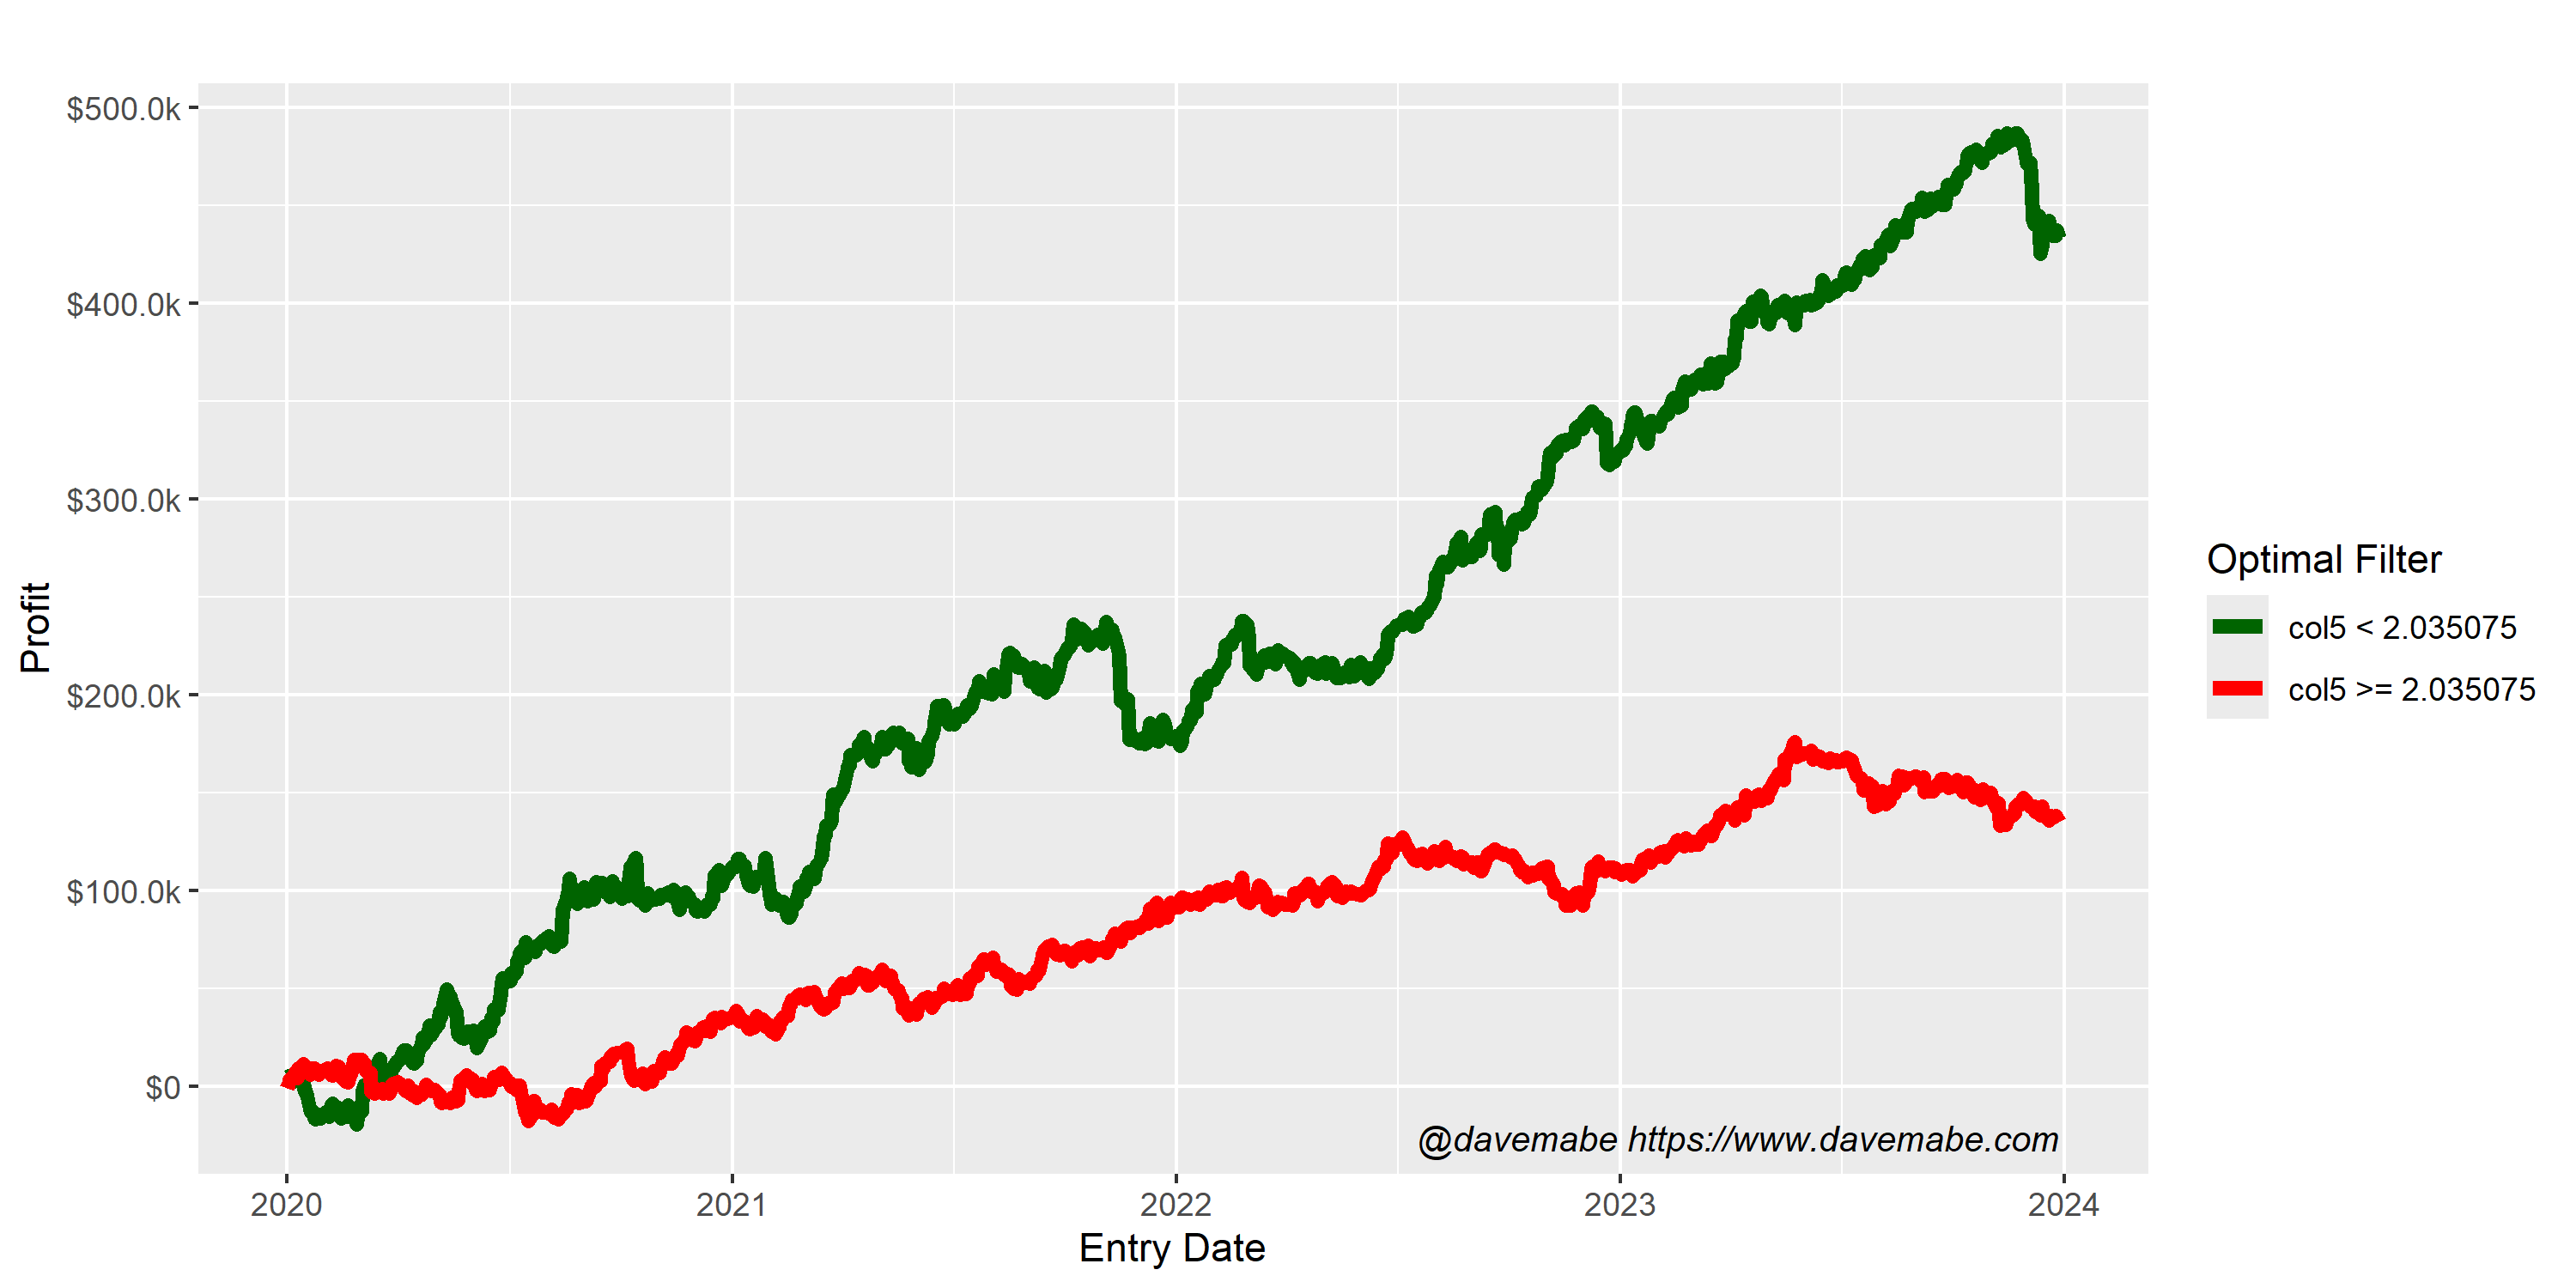
6.
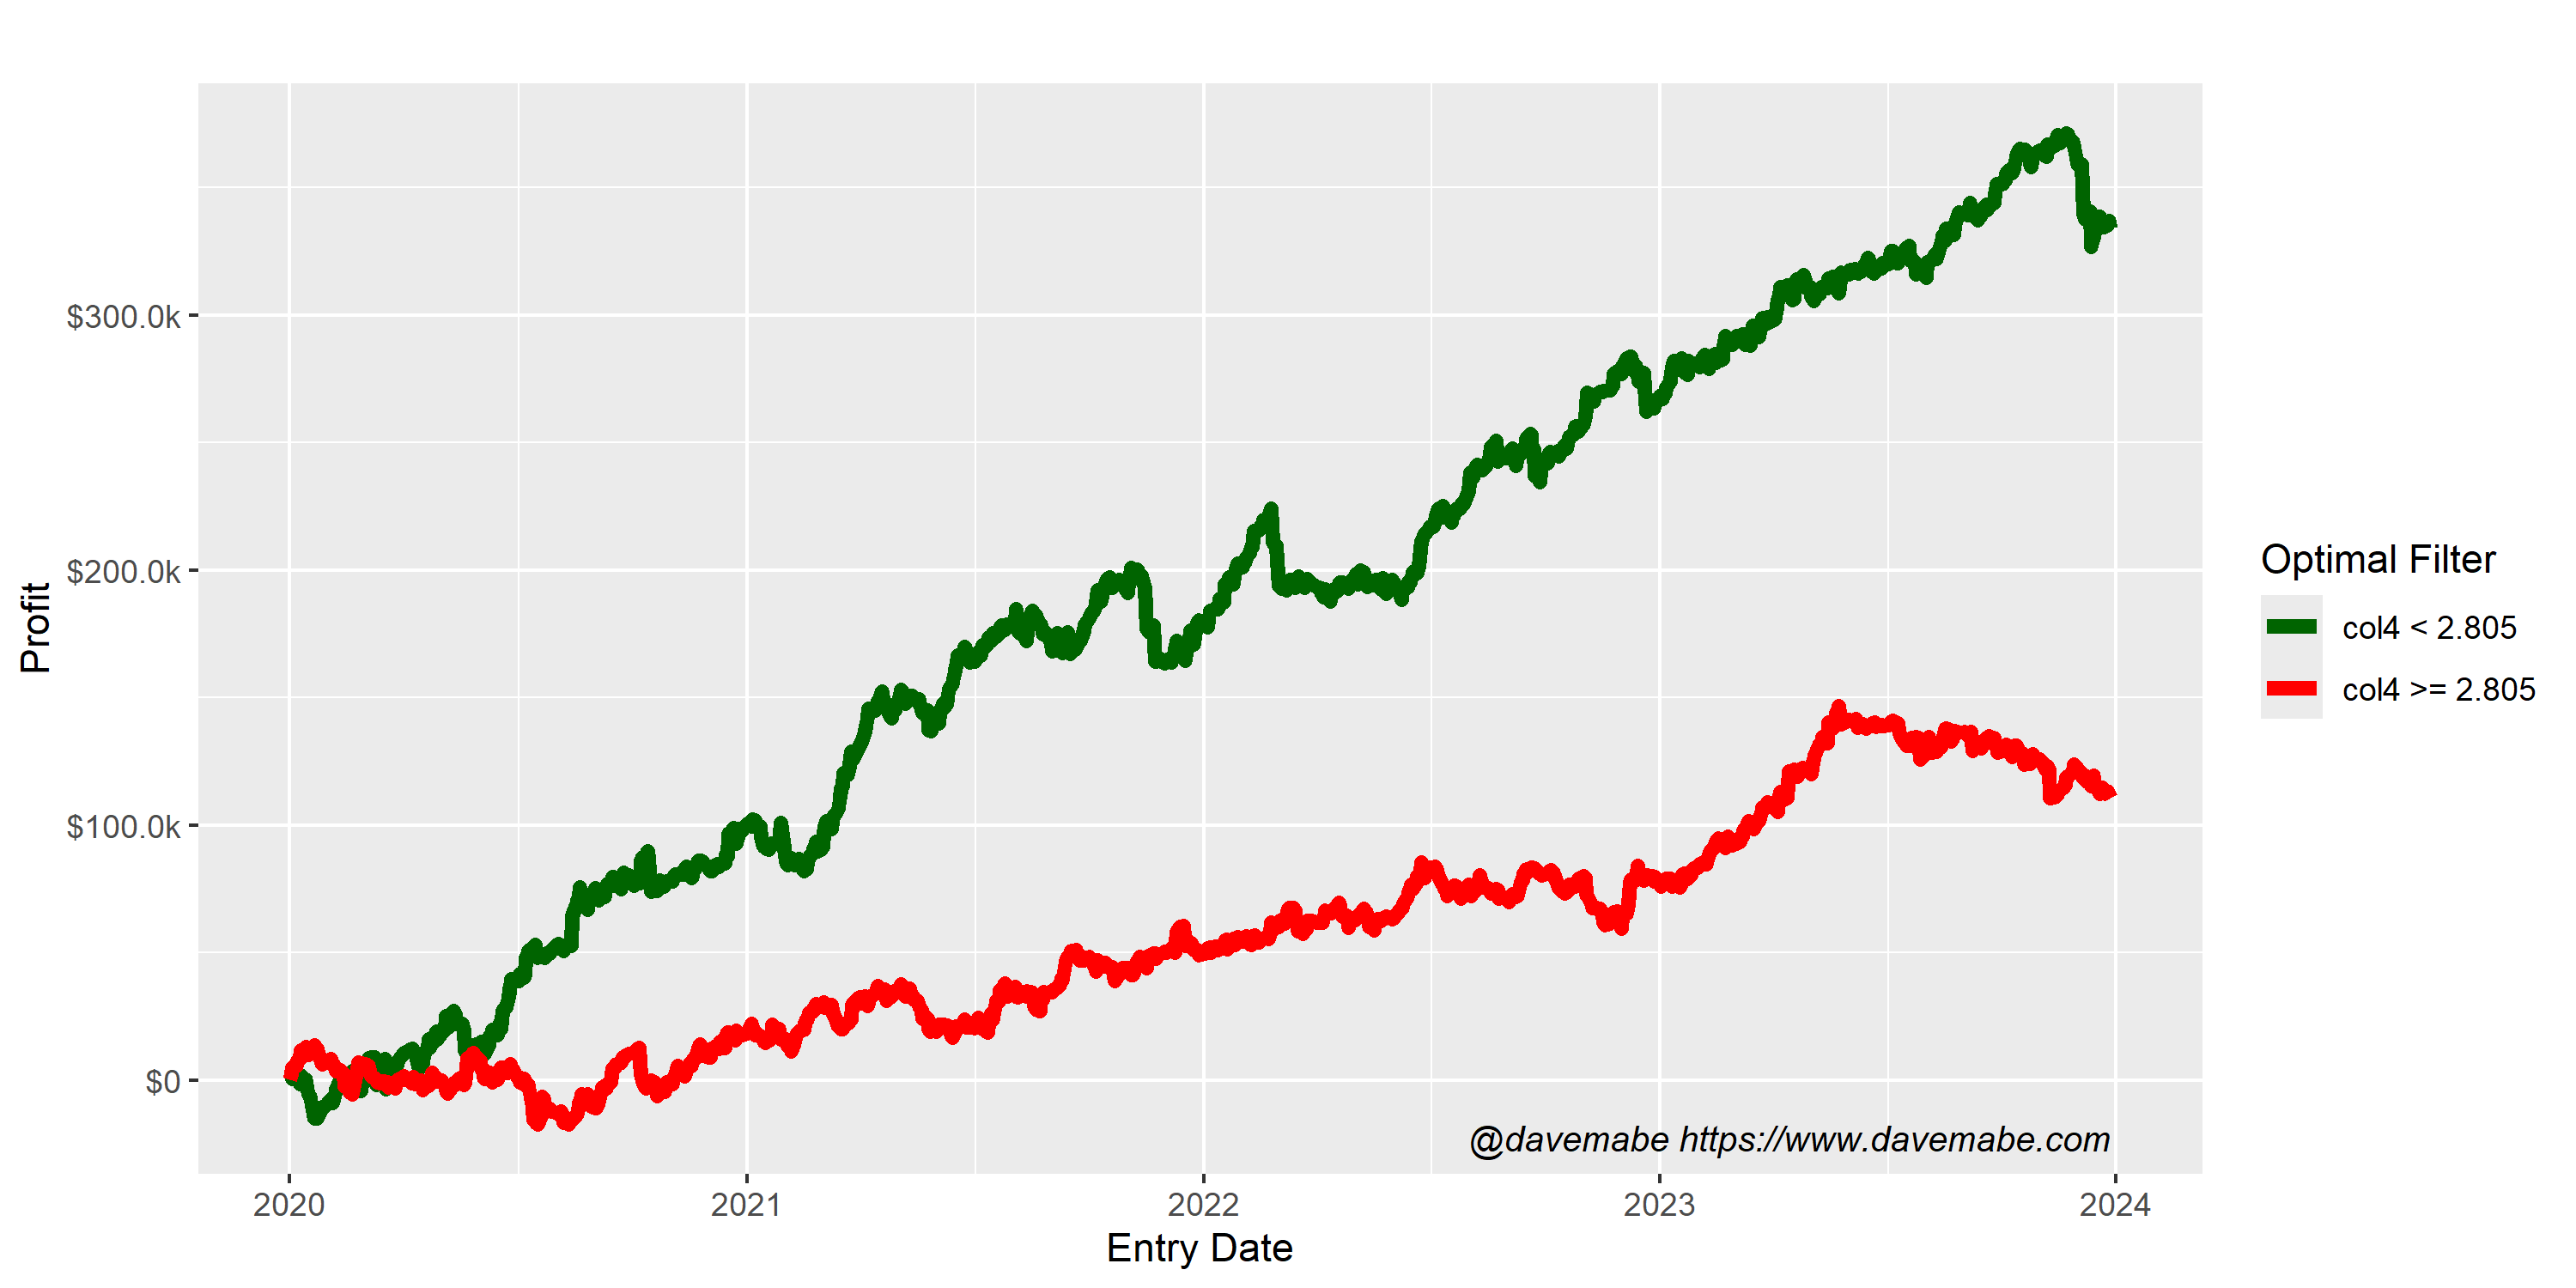
7.
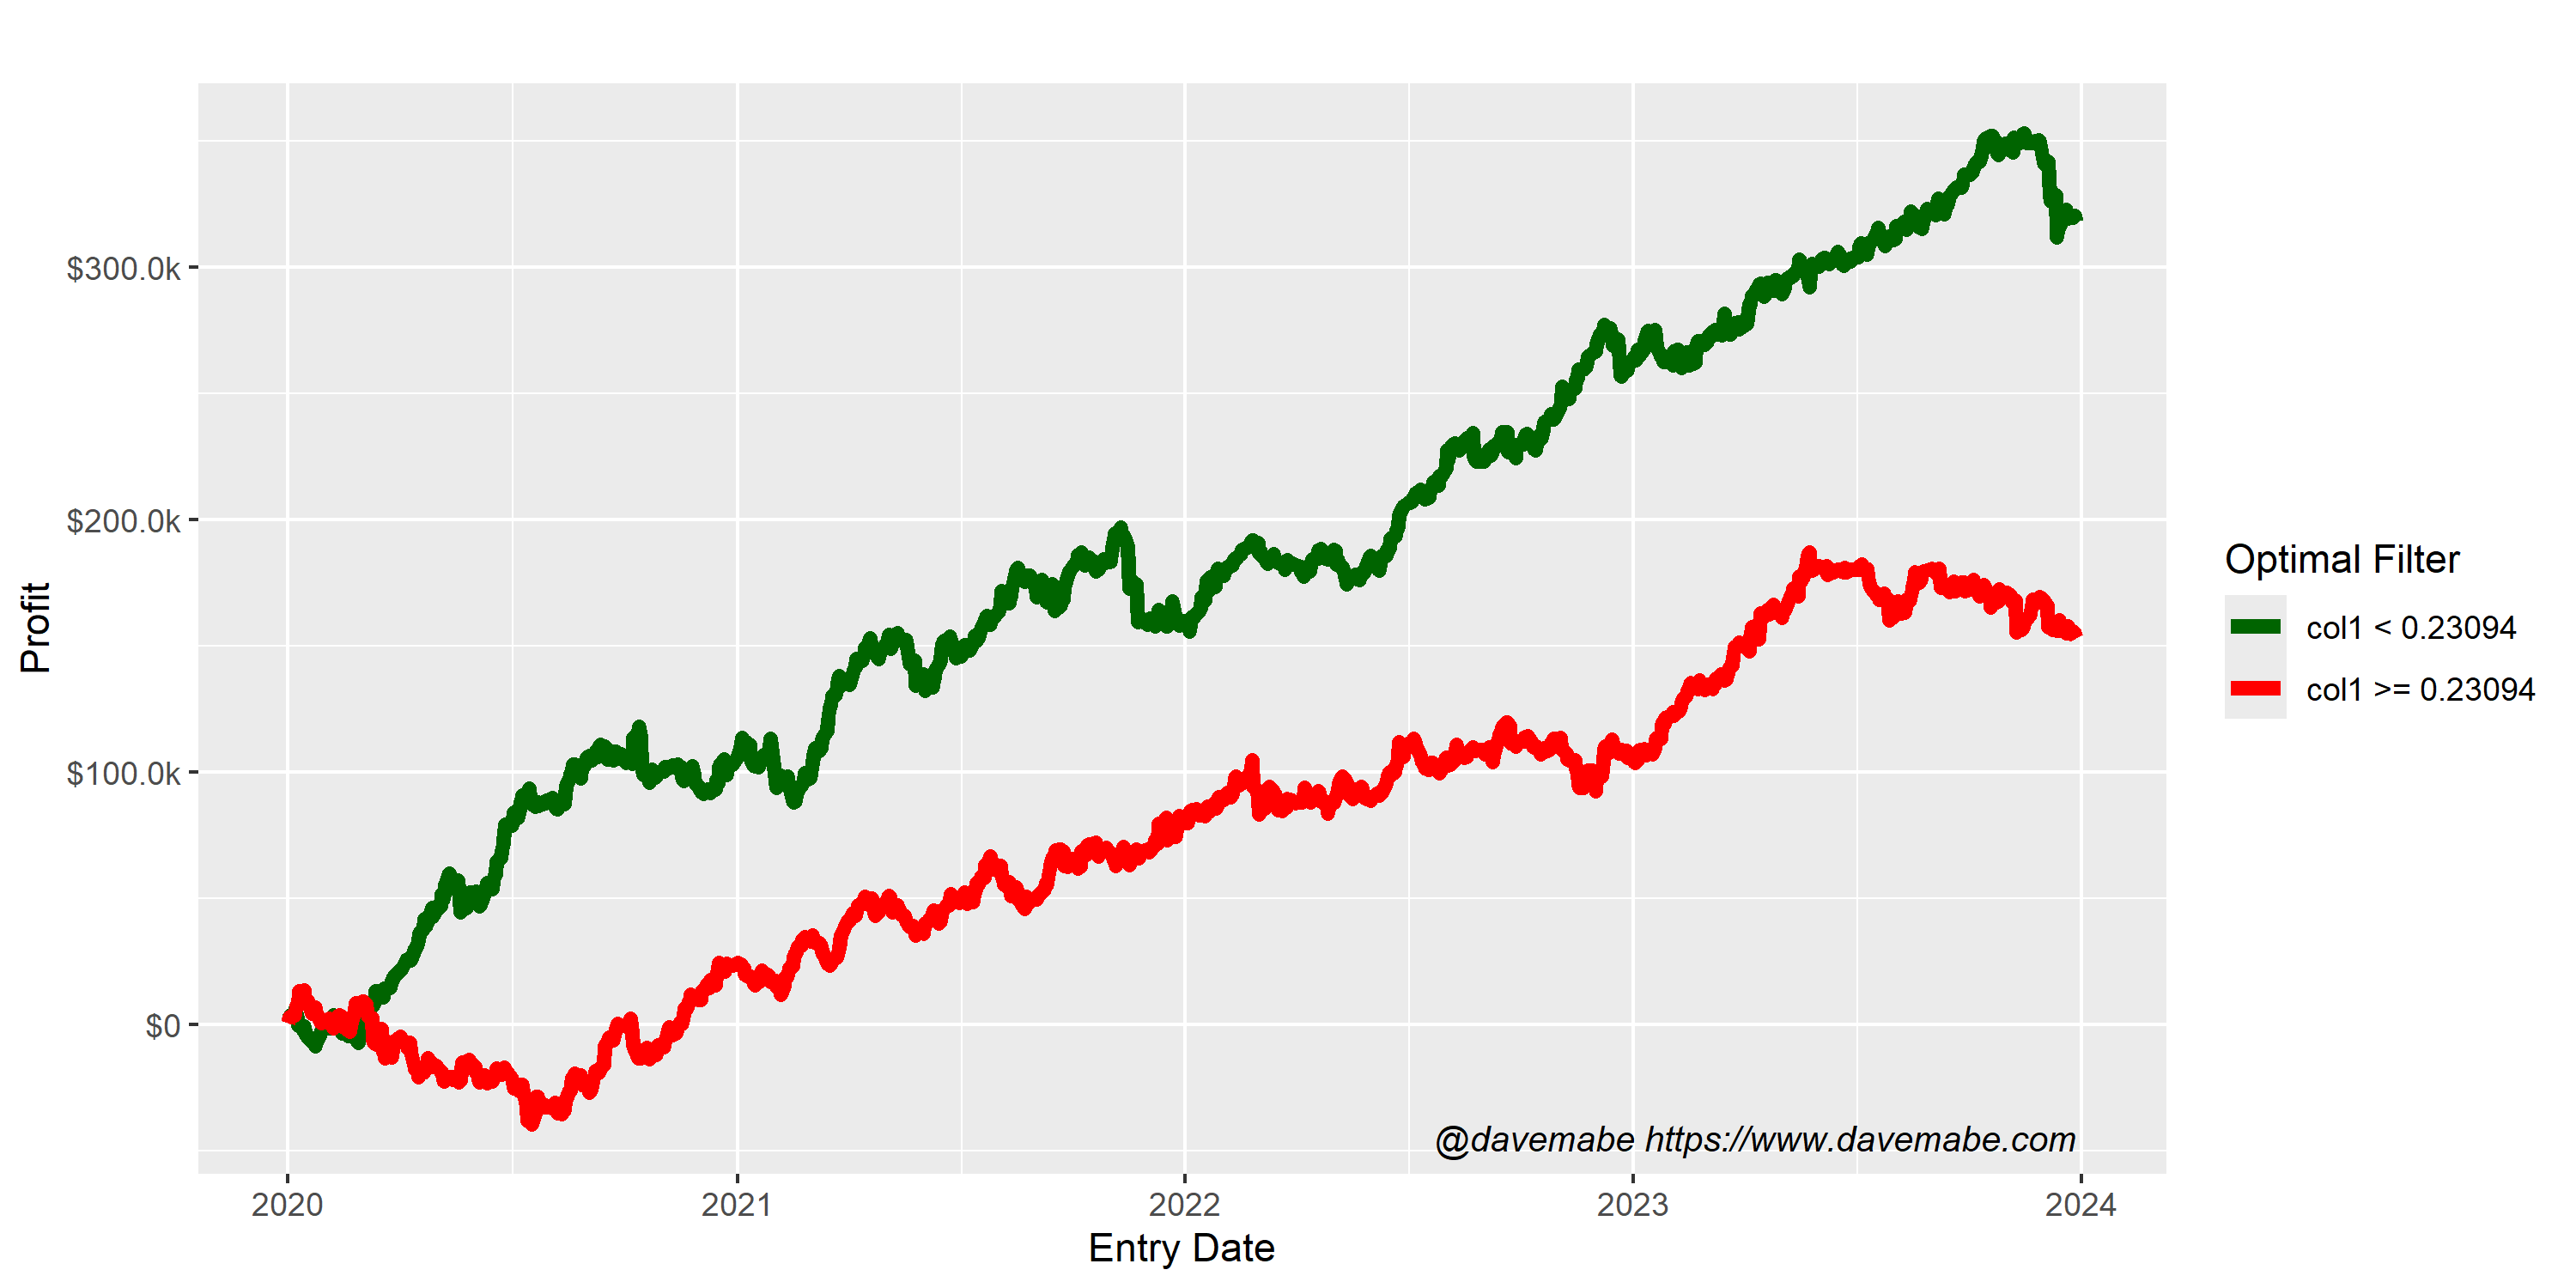
8.
